Performance dashboard
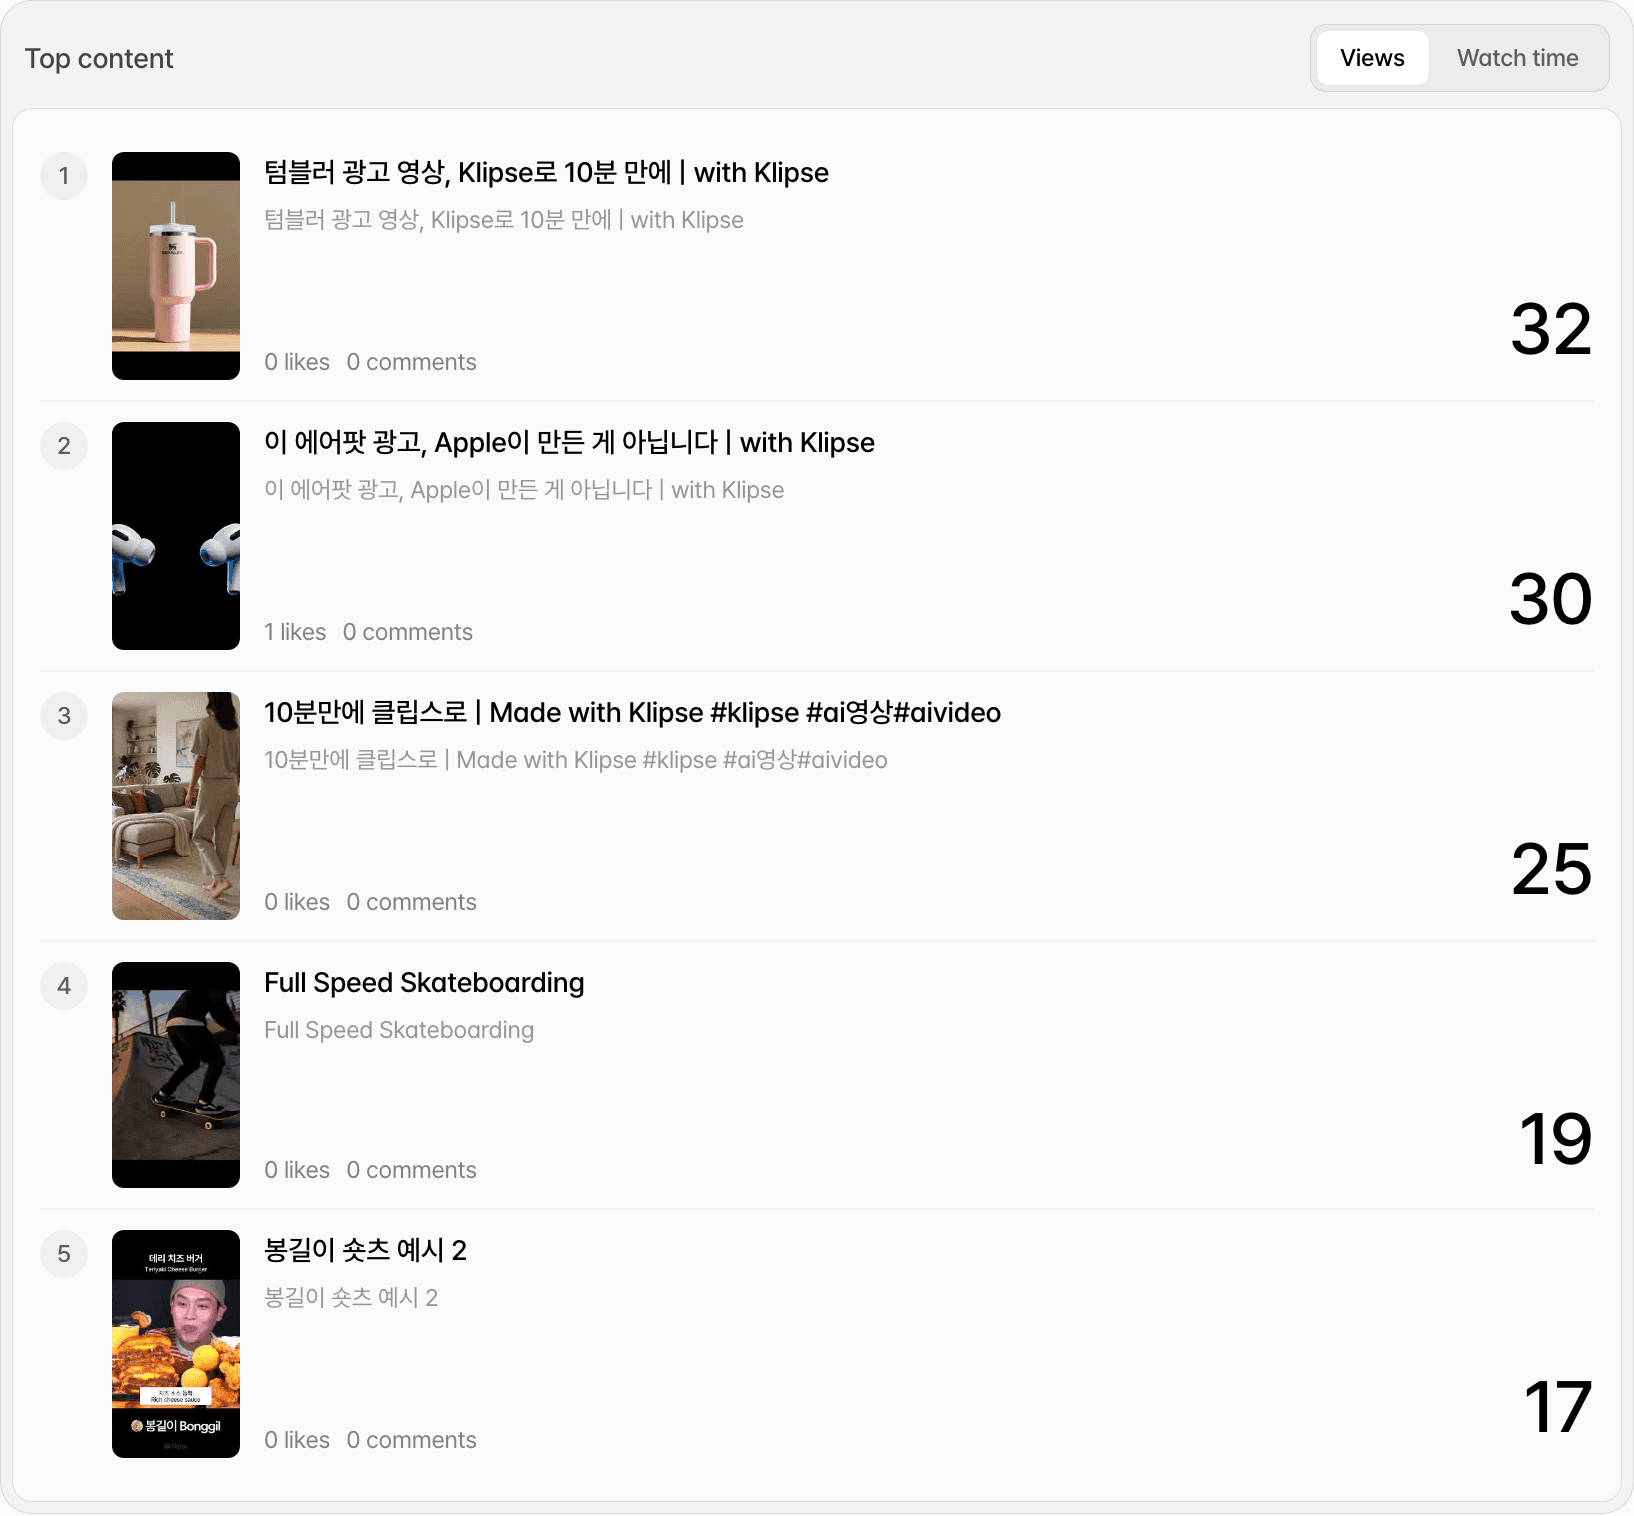
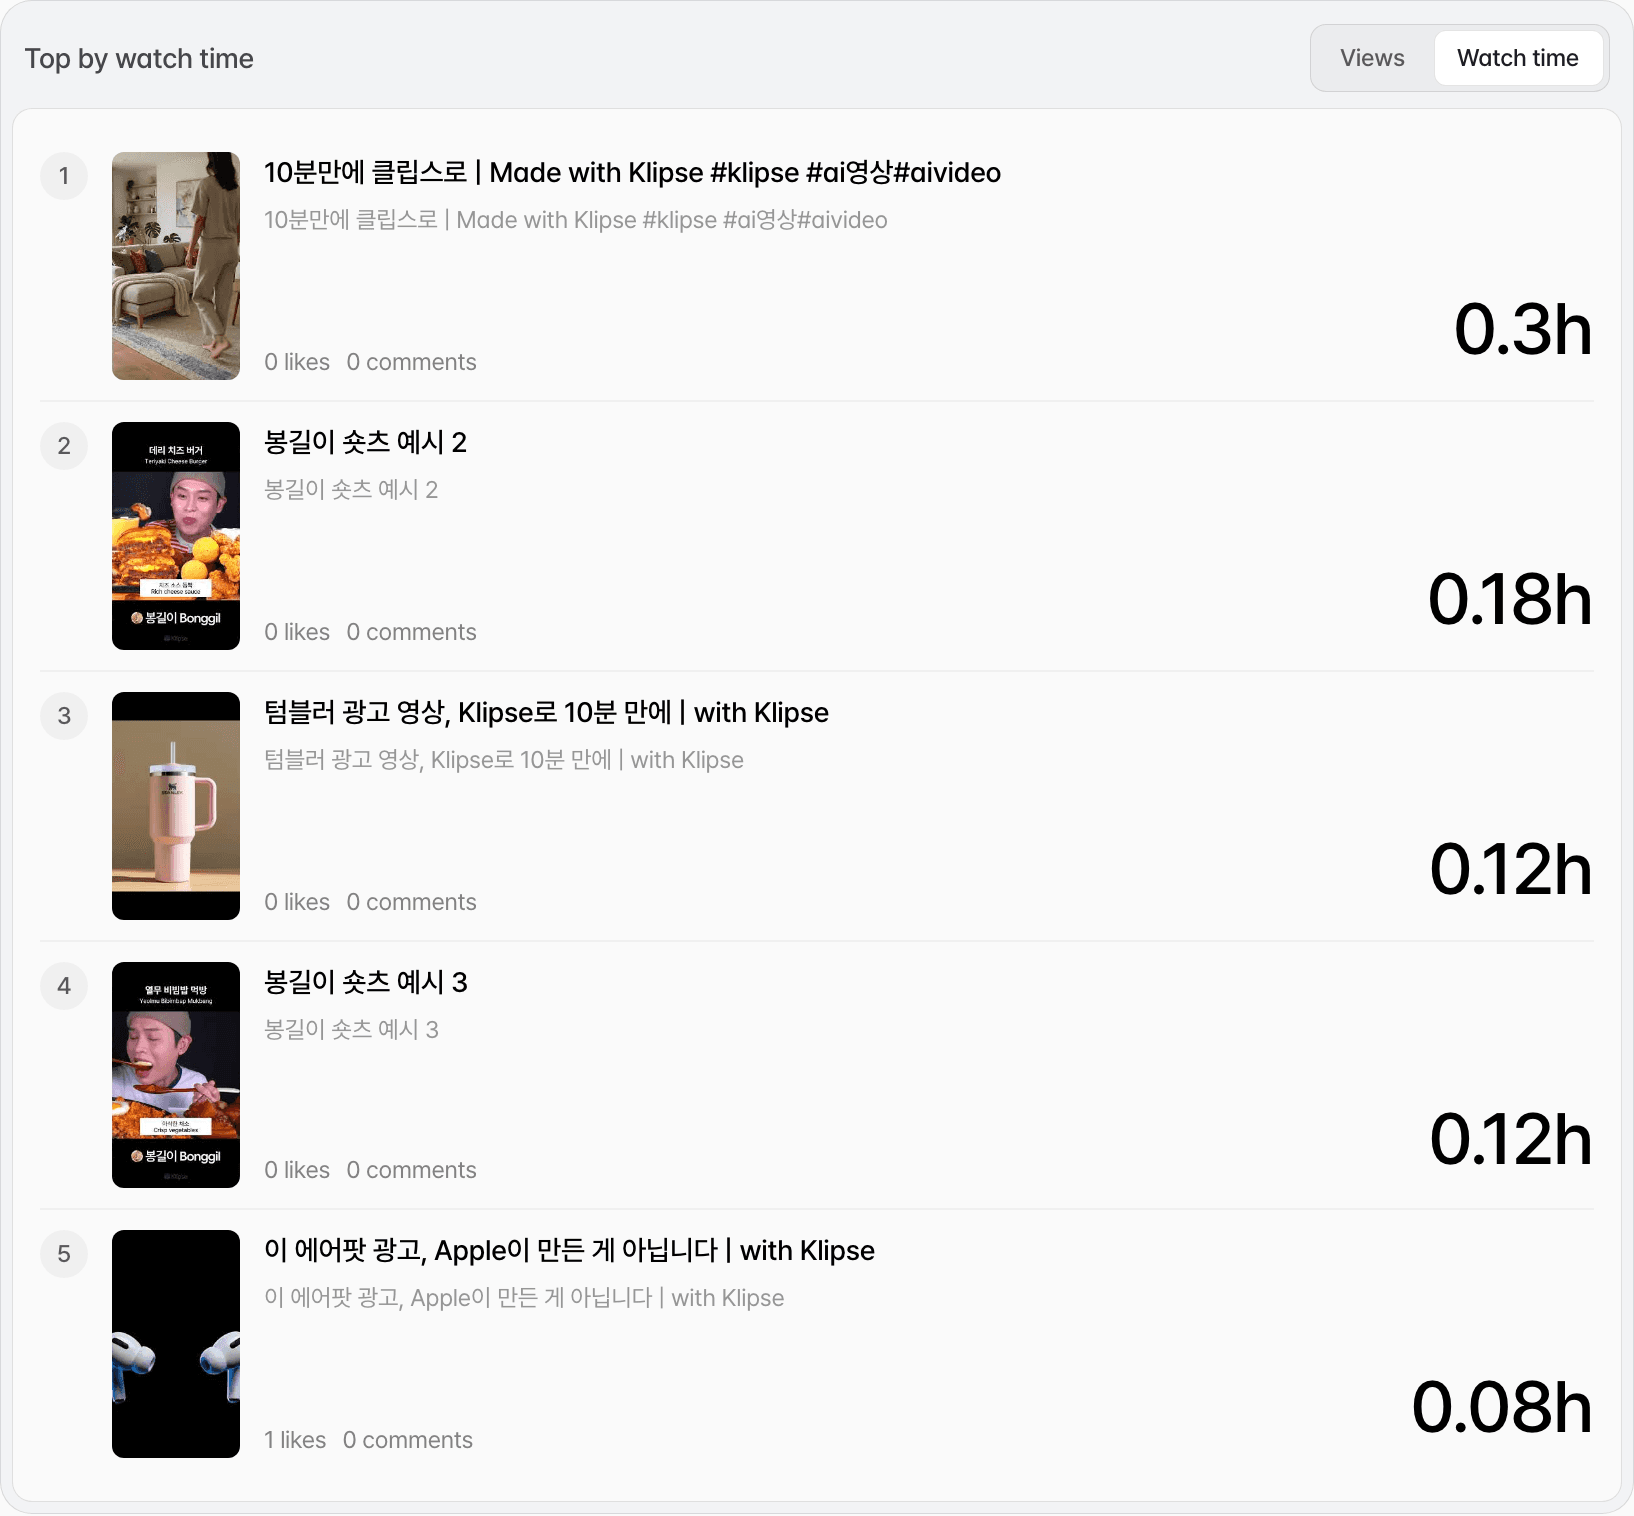
The Performance tab shows how well your content holds attention. Average view duration and average percentage viewed, with top content and traffic sources, show which videos perform well and where their viewers come from.
Key performance metrics
Avg. view duration
How many seconds an average play lasted.
Average percentage viewed
How far through the video an average play got.

Why you read the metrics together
| Situation | Example reading |
|---|---|
| Views are high but average view duration is short | People start it and leave quickly. Check whether the opening matches what the title and thumbnail promised. |
| Average percentage viewed is low | Few people reach the end for the video's length. Consider shortening it or reworking the middle. |
| Views and average percentage viewed are both high | A sign that both the topic and the structure of the content are getting a good response. |
| Views are low but watch time is long | Reach is small but the people who watched stayed. Useful when deciding whether to push the same subject wider. |
Comparing performance across videos
Comparing the performance of several videos shows which topics and formats produce relatively good results.