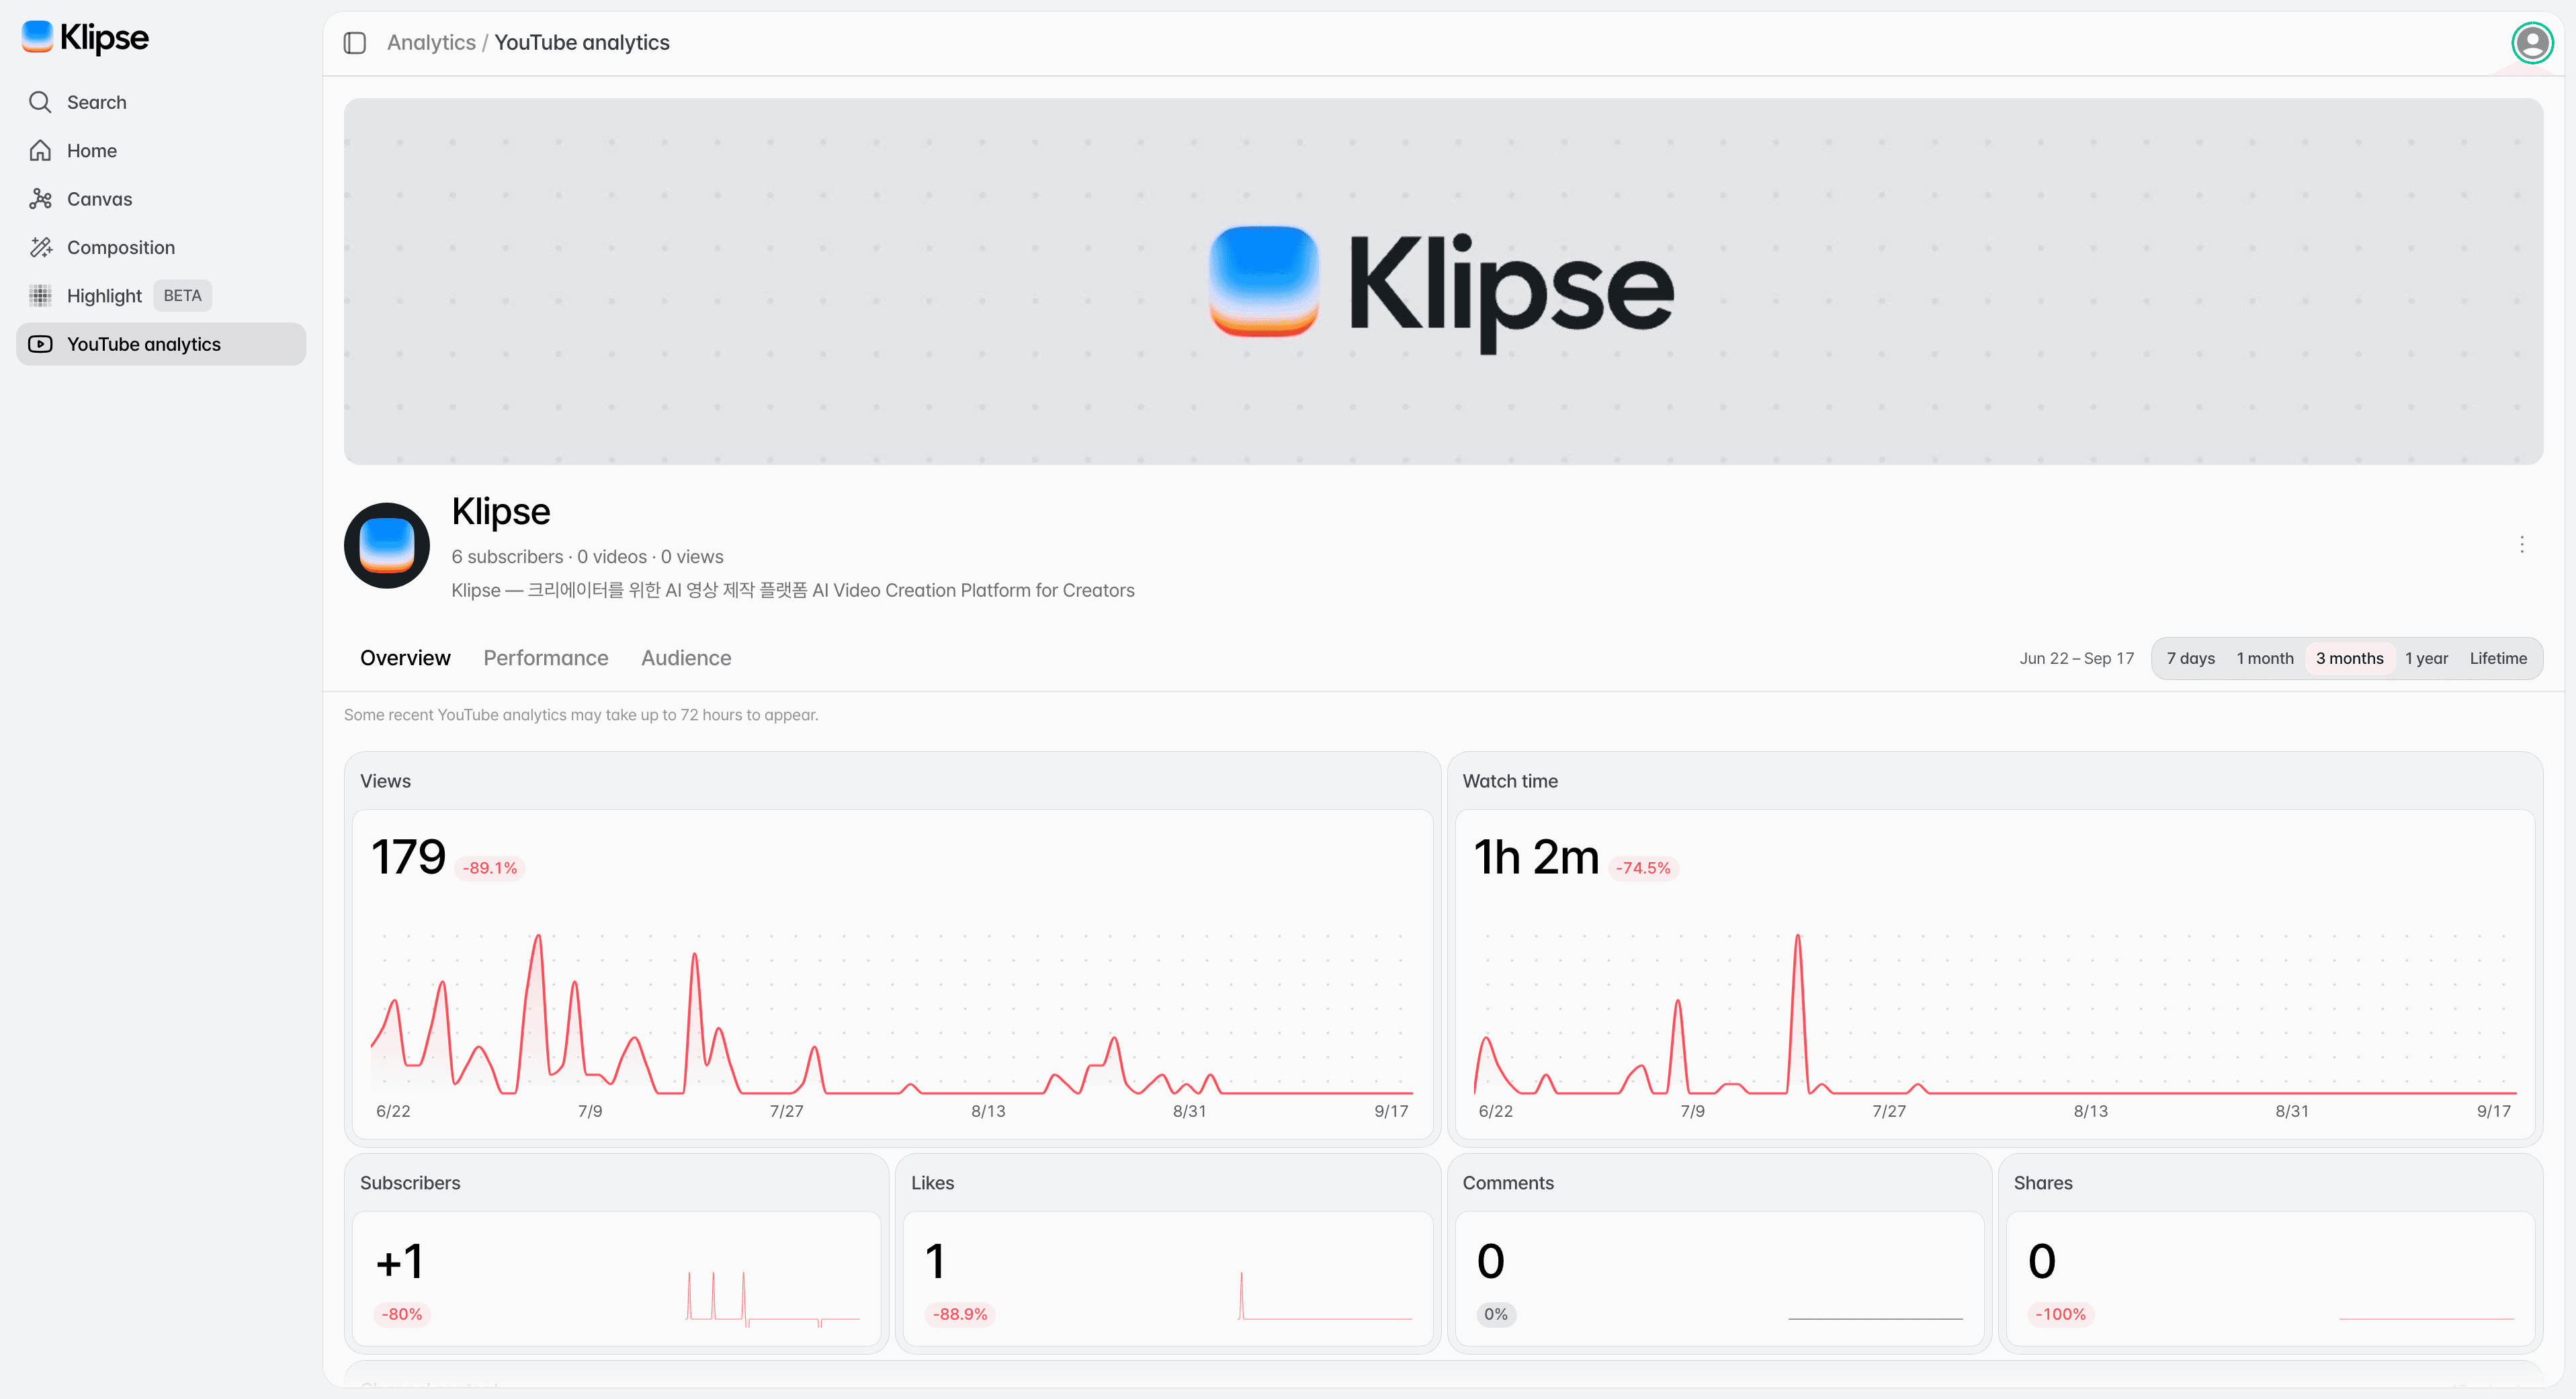
Analytics overview
Analytics shows the performance of your connected YouTube channel and its content in one place. Views, watch time, average view duration, subscriber changes, and traffic sources show which content is driving results.
What you can check in Analytics
Content performance
Check how much your content was actually consumed, through views and watch time.
Viewer response
Use watch-retention metrics to see how long viewers stay with your content.
Channel growth
View subscriber changes alongside content performance to understand how the channel is growing.
Discovery path
Use traffic sources to see how viewers reached your content.
Content comparison
Compare the key performance metrics of each video to see which content performs relatively well.
Deciding what to make next
Use the performance data to decide the topic, format, and distribution direction of your next piece of content.
The overall analysis flow
Connect your YouTube channel with a Google account to see that channel's performance by period and by tab.
Open YouTube analytics.
Select YouTube analytics in the sidebar.
Connect your Google account.
If no channel is connected, a Connect Google Account button appears. Choose the Google account that has your YouTube channel. The same connection is used by the YouTube upload node.
Choose a period and check the metrics tab by tab.
Overview shows views and watch time, Performance shows watch-retention metrics, top content, and traffic sources, and Audience shows subscriber changes and who your viewers are. Some recent data can take up to 72 hours to appear.